Did you know that…
- Nearly 1 in 5 working adults have a disability.
- In the UK there are almost 2 million people living with sight loss. Of these, around 360,000 are registered as blind or partially sighted.
- 1 in 6 of the UK adult population is affected by hearing loss. 8 million of these are aged 60 or over. And, there are 151,000 BSL users in the UK.
- 6.3 million people (Around 10% of the UK population) have dyslexia. This equates to 1 in 6 adults having a reading level of an 11 year old.
Organisations that do not have accessible websites, apps or content are not only excluding a percentage of the population, but are also at risk of lowering their overall conversion rates:
- It is estimated that there are 4.3 billion disabled online shoppers, with a spending power of £11.75 billion in the UK
- Businesses lose approx. £2 billion a month by ignoring the needs of disabled people
Source: The Purple Pound infographic
Accessibility during the Covid-19 pandemic
With all these stats considered, we can all see why accessibility needs to be at the forefront of our minds. However, during the current pandemic there has been a surplus of infographics relating to Covid-19, which have failed to be accessible by not having text alternatives available. This has caused frustration online for many users who claim that this key information isn’t accessible and openly available to everybody.
Twitter accounts, such as @CovidAccessinfo are aiming to make sure that all vital updates are provided in an accessible way, if they weren’t originally posted in an accessible format by the originator.
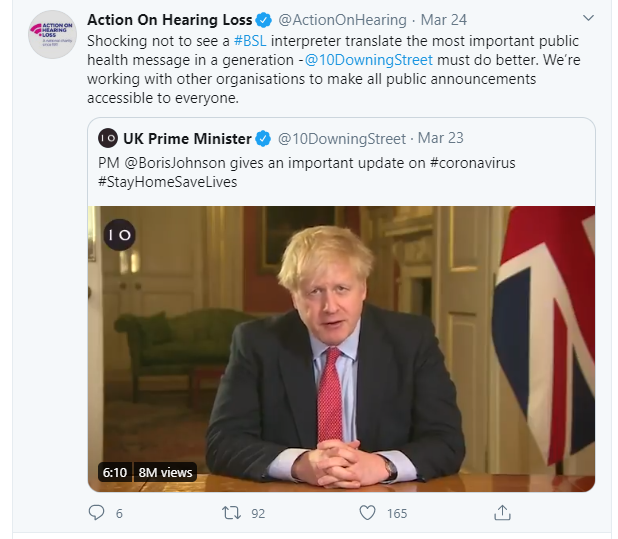
Accounts such as @10DowningStreet, have faced criticism and have been guilty of similar examples, despite having millions of followers.


